Climate and Environment

Climate change has an impact on health and wellbeing and how we live is creating in increasing footprint on our environment, resulting in the depletion of resources, increased generation of waste and pollution.

Climate change is resulting in hotter and drier conditions, changes in rainfall patterns and more frequent and extreme weather events including prolonged droughts, heat waves and damaging storms. Reduction of greenhouse gas emissions is needed to prevent any further increase of impacts from climate change.

Hume Snapshot

The main environmental health challenges facing Hume City arise from climate change and include the increasing frequency and severity of heat waves; and extreme storms and wild fires.

Hume City residents benefit from world-class water supplies and sewerage systems and access to a variety of healthy foods.

Air quality is generally good.

Hume City is the home to significant biodiversity values, conservation reserves, open space and precious waterways.  

Hume’s tree canopy is relatively low compared to other areas across Melbourne.

Older homes with poor quality thermal envelopes (including draughty homes without insulation) are more at risk to temperature extremes as are those without air-conditioning. 

Detailed Context 

Tree Canopy Cover

Tree canopy cover has been found to have the strongest relationship with reducing heat in urban areas. A target of 20%-40% canopy cover is required for a healthy, liveable city. Analysis of metropolitan Melbourne vegetation cover in 2018 estimates that the tree canopy cover across Hume City is 5.3%. This is the third lowest rate across metropolitan local government areas and significantly lower than the metropolitan Melbourne rate of 16.2%.

Internal Council analysis has found that the urban areas of Sunbury (6.4%) and Greenvale (6.2%) have the highest cover across the municipaltiy while some of Hume’s newest developing areas have much lower levels of canopy cover, including Mickleham (2.3%) and Craigieburn (1.9%).

Tree canopy cover, 2018

Tree canopy cover, 2018

Urban Heat and Heat Vulnerability

Hume City is susceptible to the urban heat island (UHI) effect. This phenomenon occurs in areas with extensive hard surfaces that absorb heat and subsequently release it into the atmosphere, leading to higher temperatures. Additionally, vehicle exhaust and emissions from air conditioners and other energy sources further exacerbate this effect. Hume is ranked number eight in Greater Melbourne in experiencing increased temperature because of the UHI effect. As a result, Hume experiences average summer temperatures 9.23 degrees higher than in non-urban (baseline) areas.

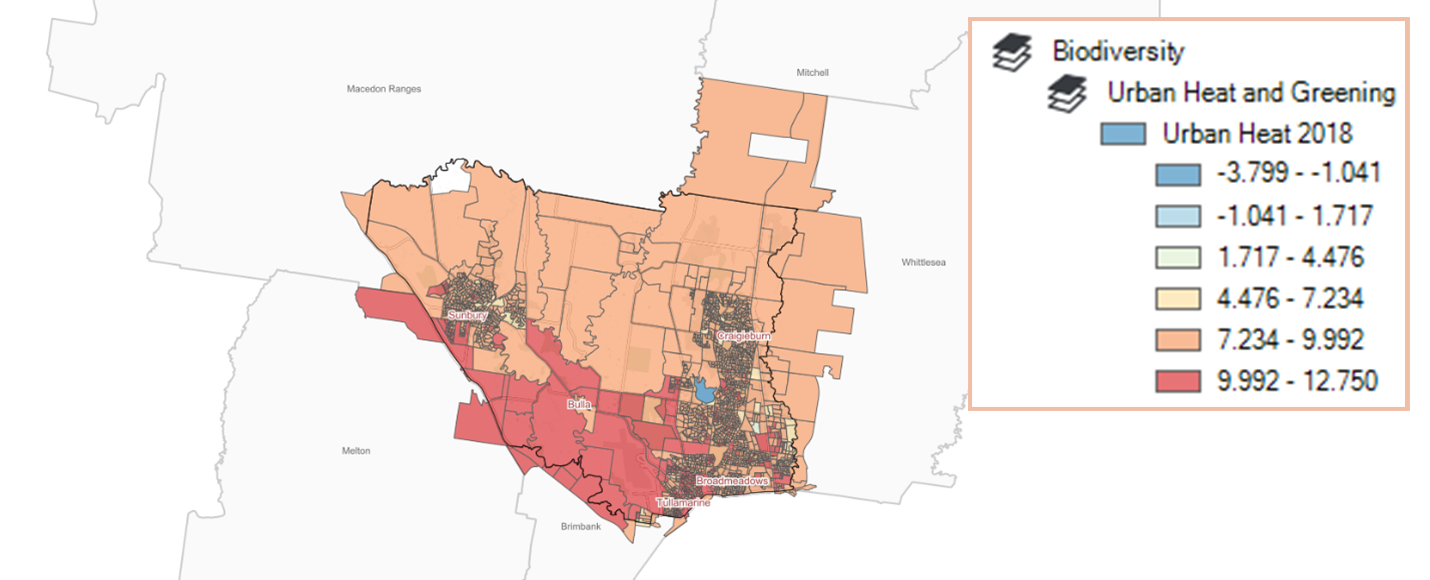
The map below is from Victorian Government urban heat layers from 2018. It shows how many degrees Celsius the average temperature within urban parts of Hume City is above a non-urban baseline. For most of Hume, including green wedge and rural areas, average temperatures are in the range of 7.2-9.9C above a non-urban environment with significant areas around Sunbury and in the urban corridor from Broadmeadows to Craigieburn experiencing more heat on average 9.9-12.7C above a non-urban environment.

vulnerable populations are to extreme heat events and clearly shows that most of Hume’s population has a high level of vulnerability to extreme heat.

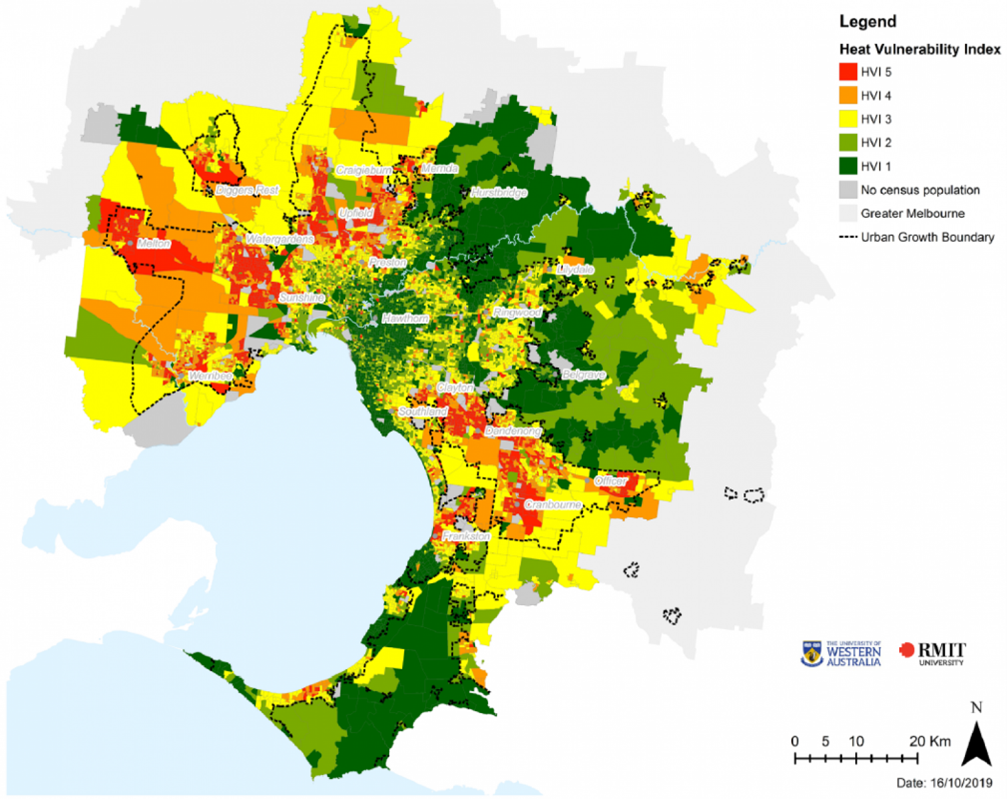
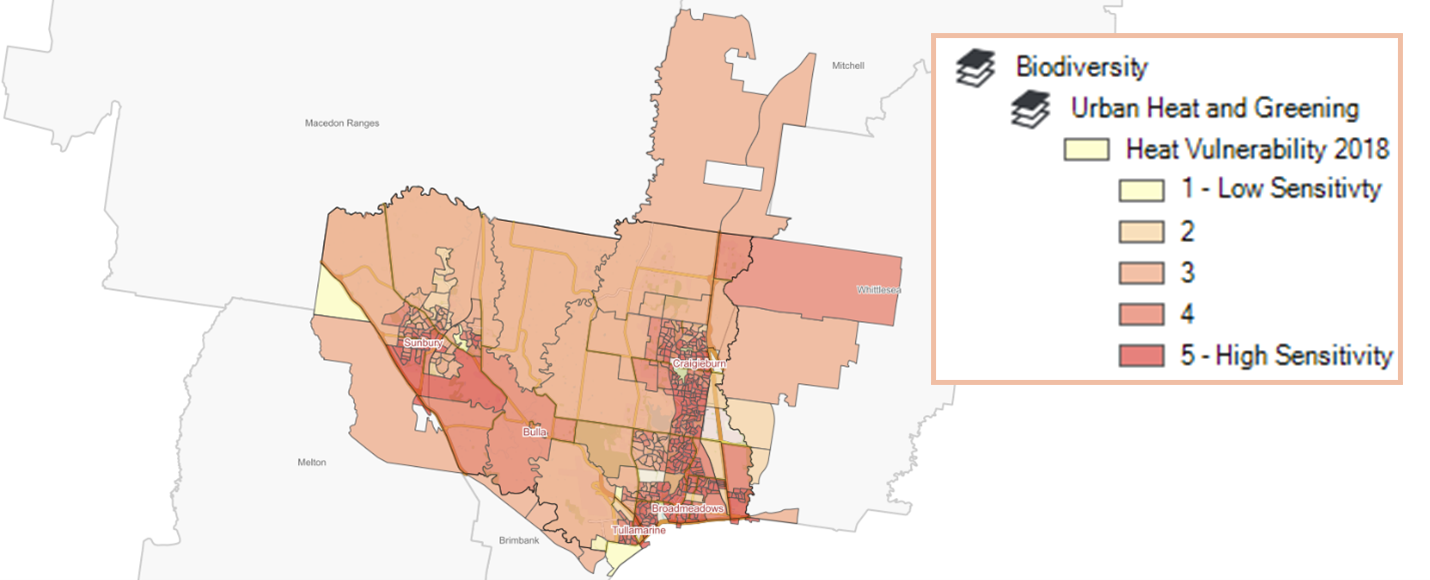
The Heat Vulnerability Index (HVI) identifies which populations are most vulnerable to heat and is determined by three components: heat exposure; sensitivity to heat due to land cover, population density and age; and adaptive capacity including socio-economic advantage or disadvantage. The following map displays how vulnerable populations are to extreme heat events and clearly shows that most of Hume’s population has a high level of vulnerability to extreme heat.

The Heat Vulnerability Index (HVI) identifies which populations are most vulnerable to heat

Heat vulnerability index across Greater Melbourne, 2018

Heat vulnerability index across Greater Melbourne, 2018

Greenhouse Gas Emissions

The Climate Snapshot produced by Ironbark Sustainability and Beyond Zero Emissions estimates Hume City produced 3.773 million tonnes of carbon emissions (tCO2e) in 2021-22. Electricity use was the largest contributor (31%), followed by aviation emissions (29%), road transport (15%) and gas use (11%). While located in Hume City, Melbourne Airport is a Commonwealth jurisdiction and aviation emissions are the result of travel in and out of Melbourne airport. Emissions from electricity and gas use are largely produced by Hume’s industrial businesses. Hume City recorded the second highest emissions levels across metropolitan Melbourne council areas.

Hume City 2021/22 municipal emissions snapshot

Emissions Snapshot Hume City 2021-22

Household Solar Power

Converting sunlight into electricity through solar photovoltaic (PV) systems represents a significant move away from fossil fuels. Over 21% of Australian households have installed solar PV systems, the highest adoption rate globally. Across Victoria 28.8% of houses have solar installations as at June 2024, while in Hume City 32.5% of dwellings have solar. Solar uptake in Hume is generally higher in the growth suburbs and rural areas and lower in the older established suburbs where there are larger proportions of rental properties.

Percentage of homes with solar power by postcode, June 2024

Percentage of homes with solar power by postcode, June 2024